Data Analyst

Emil Jursevics

Still learning every day. Every step gets full effort.

About me

I mainly work with SQL, Tableau, Python, and Excel. Those are the tools I use most often, but I’ve tried others when projects called for it. I come from a Computer Programming and IT Systems background, which gave me a solid technical base, but I’ve gravitated toward data analytics because data fascinates me - everything is data. I’ve often been told I explain things clearly, so presenting results in a way people actually understand comes naturally to me.

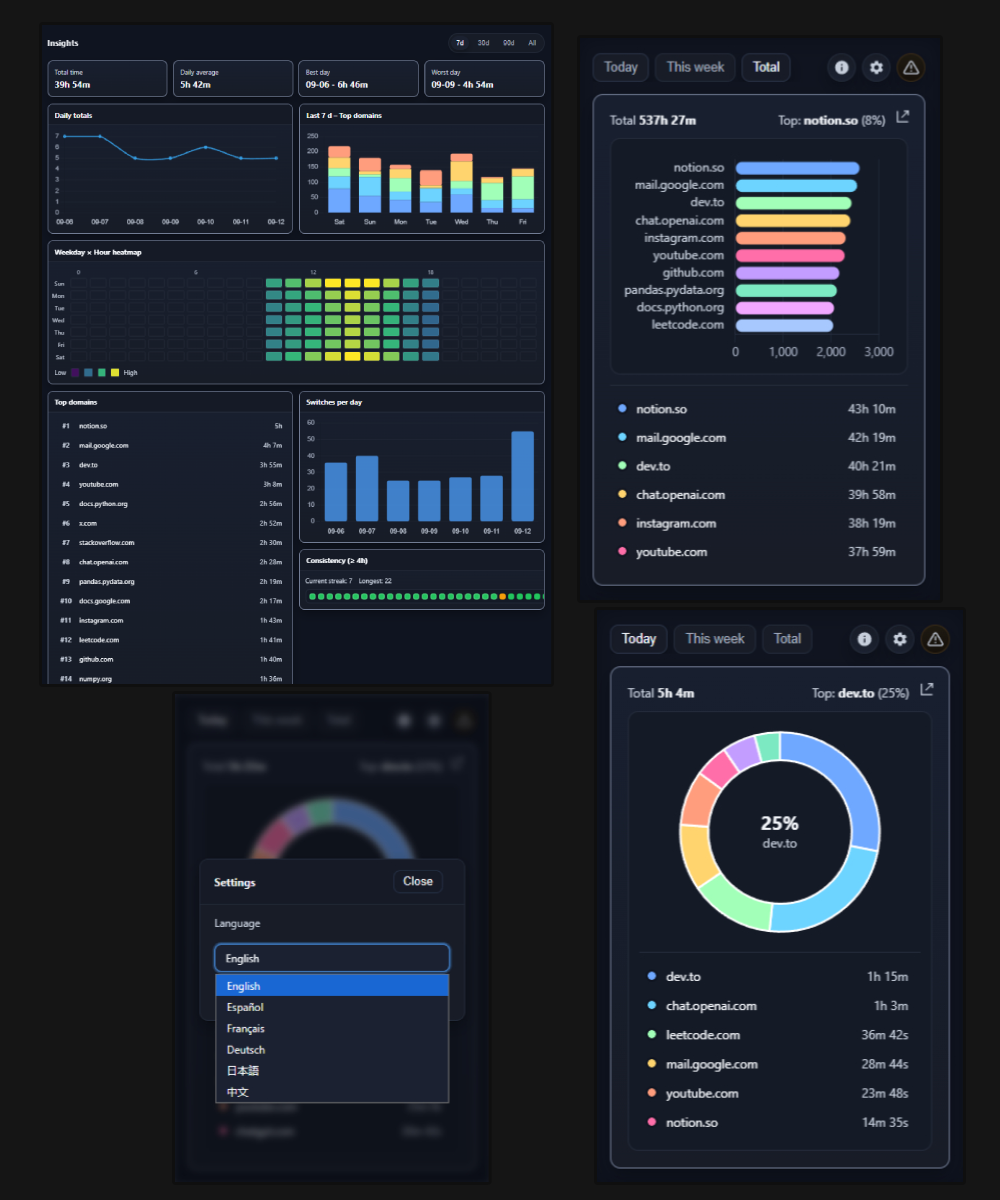
Some of my favorite projects include TimeLense, a Chrome extension that turned 90 days of browsing data into productivity dashboards, and a Car Market Scraper that analyzed regional car pricing trends in Latvia. In 2025, I interned at Draugiem, where I worked with SQL, Tableau, and Excel on data cleaning and reporting tasks.

Honestly, I just like data.

Skills

Core
Python (Jupyter, Pandas, Matplotlib)
SQL (joins, window functions, CTEs)
Exploratory analysis
BI & Viz
Tableau
Looker
Excel
Storytelling & layout
DataOps
APIs
Web scraping
Git/CLI basics

Projects

Auto Price Analysis for SS.lv hero
2025

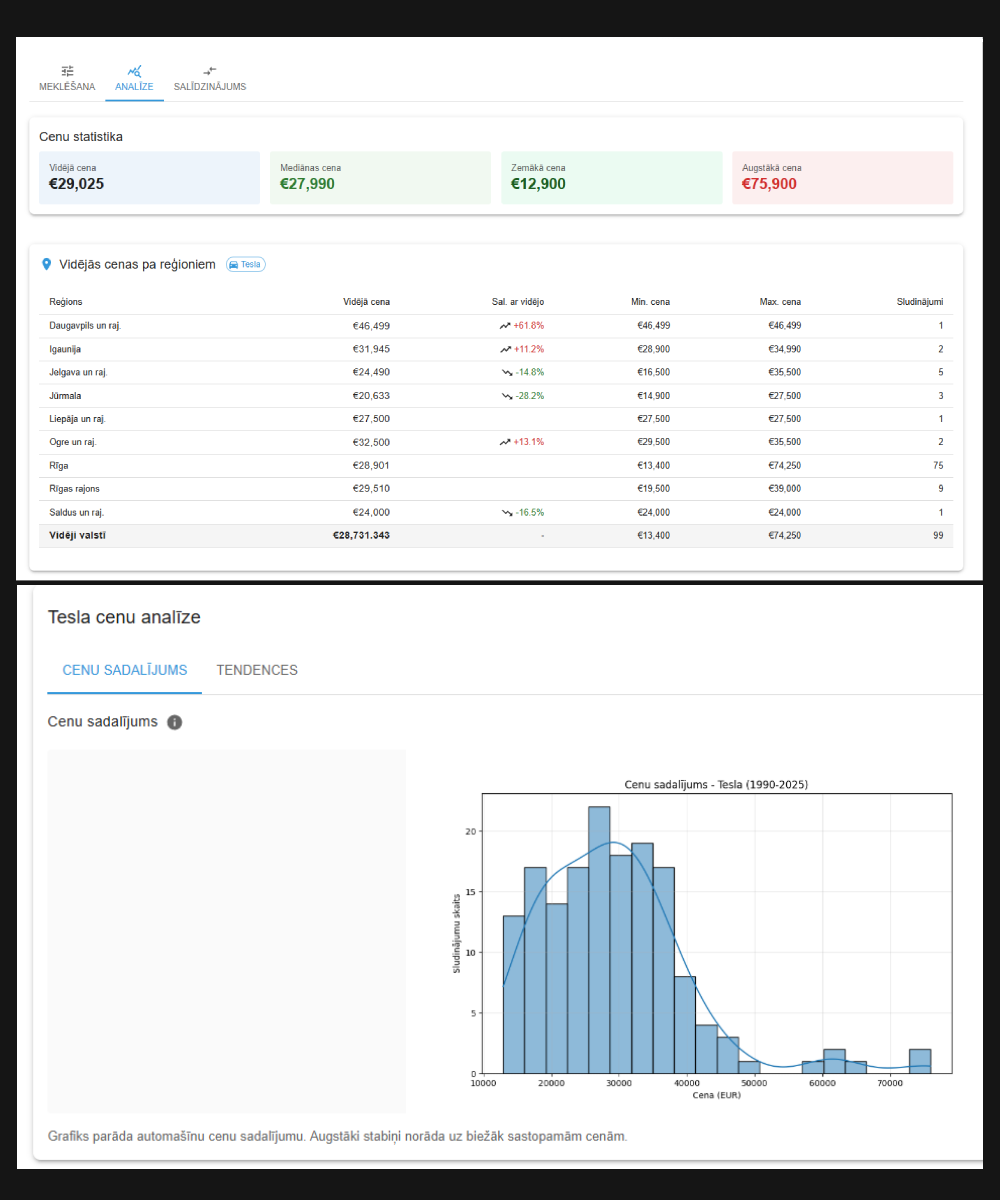
Auto Price Analysis for SS.lv

One of my first bigger projects, I built a tool that scrapes car listings from SS.lv, cleans the data, and shows price gaps across regions. It started as a school project, but I kept building on it to make it more useful. The goal was always simple - give a quick, trustworthy snapshot of what the car market looks like.

ScrapingPandasVisualizationSQLite
What I built
  • Scraper for listings and metadata
  • Data cleaning + joins into tidy tables
  • Charts for regional gaps, distributions
Why it’s useful
  • Clear picture of relative pricing
  • Fast to run and iterate
  • Easy to extend with new sources
  • Uses real existing data, so its actually useful
Price Impact of Crypto Events hero
2025

Price Impact of Crypto Events

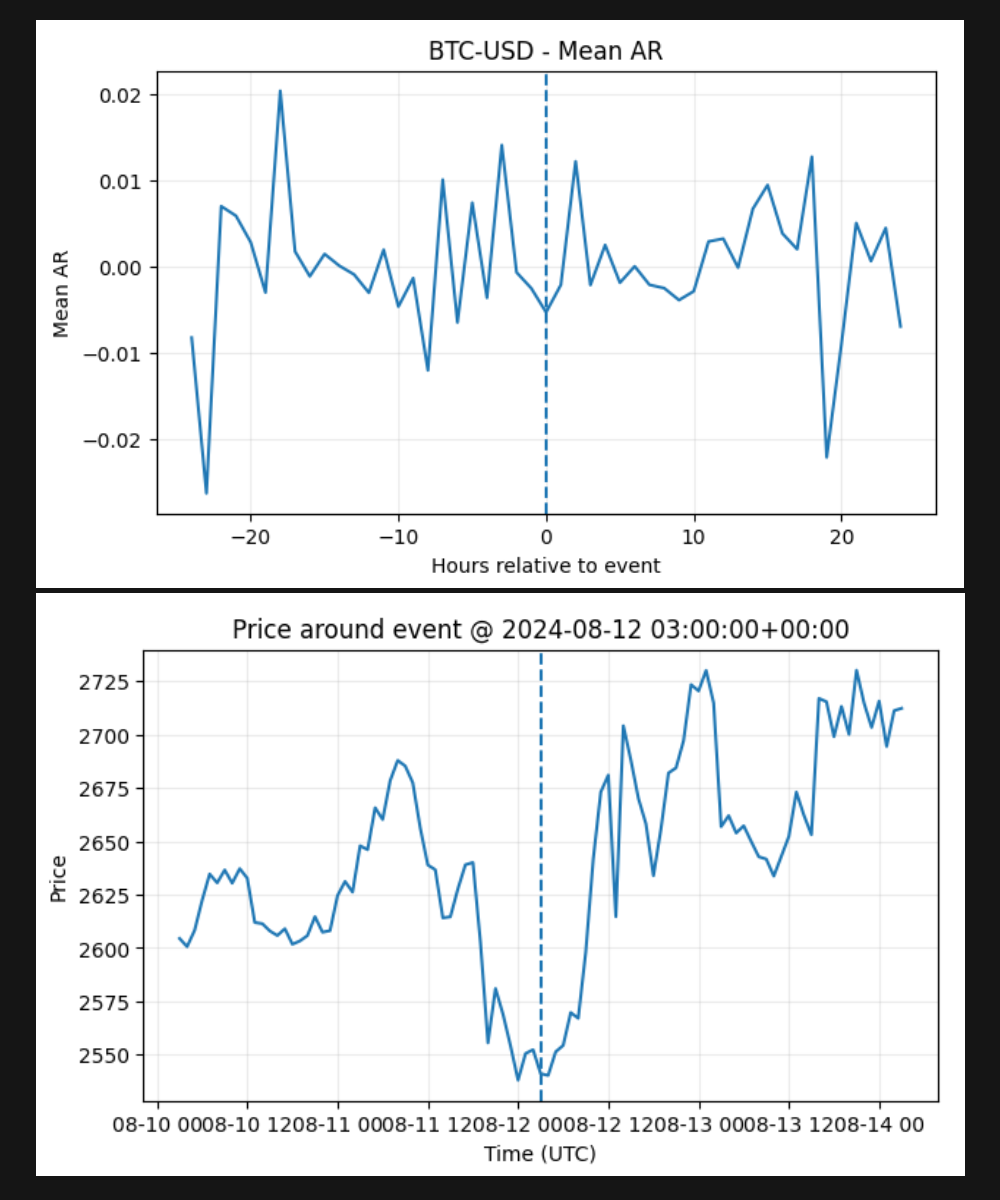
I made this while I was trying to learn more about crypto and how markets actually react around big events, things like BTC Halvings, exchange hacks, or major upgrades. It was also a way for me to get comfortable working with pandas and matplotlib. The project pulls hourly price data, runs event windows, and plots the results so you can see whether the market moved because of real impact or just hype.

Event StudyCryptoPandasMatplotlib
What I built
  • Hourly price data via yfinance
  • AR, CAR around event windows
  • Deterministic scripts, folders
  • HTML report with figures
Why it’s useful
  • Quantifies impact vs hype
  • Easy to re-run as events change
  • Good base for further analysis or development
Crypto Event Study, Tableu Dashboard hero
2025

Crypto Event Study, Tableu Dashboard

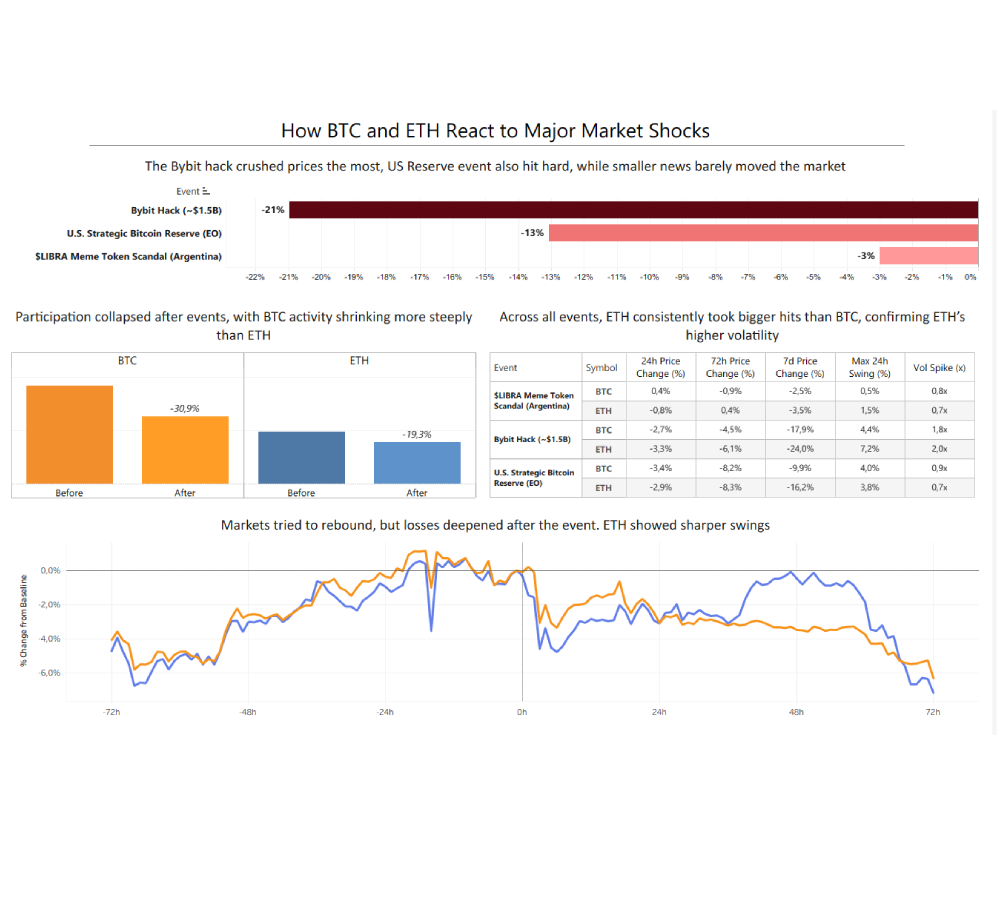
The dashboard ranks events by 7 day impact, shows volume before/after, and compares BTC vs ETH across horizons. Some headline insights: Of my events, the Bybit hack drove the steepest 7 day drawdown, trading activity shrank right after shocks, ETH consistently took deeper percentage hits than BTC.

StorytellingTableauComparative Analysis
What it shows
  • Event ranking by 7 day price change
  • 24h volume before vs. after each event
  • BTC vs. ETH performance table
  • Price paths aligned to event time
What to notice
  • Bybit hack: largest drawdown of the events
  • Participation drops after shocks
  • ETH has higher volatility
  • Brief bounce into events, then slide
TimeLense Usage Dashboard (Built on My Extension) hero
2025

TimeLense Usage Dashboard (Built on My Extension)

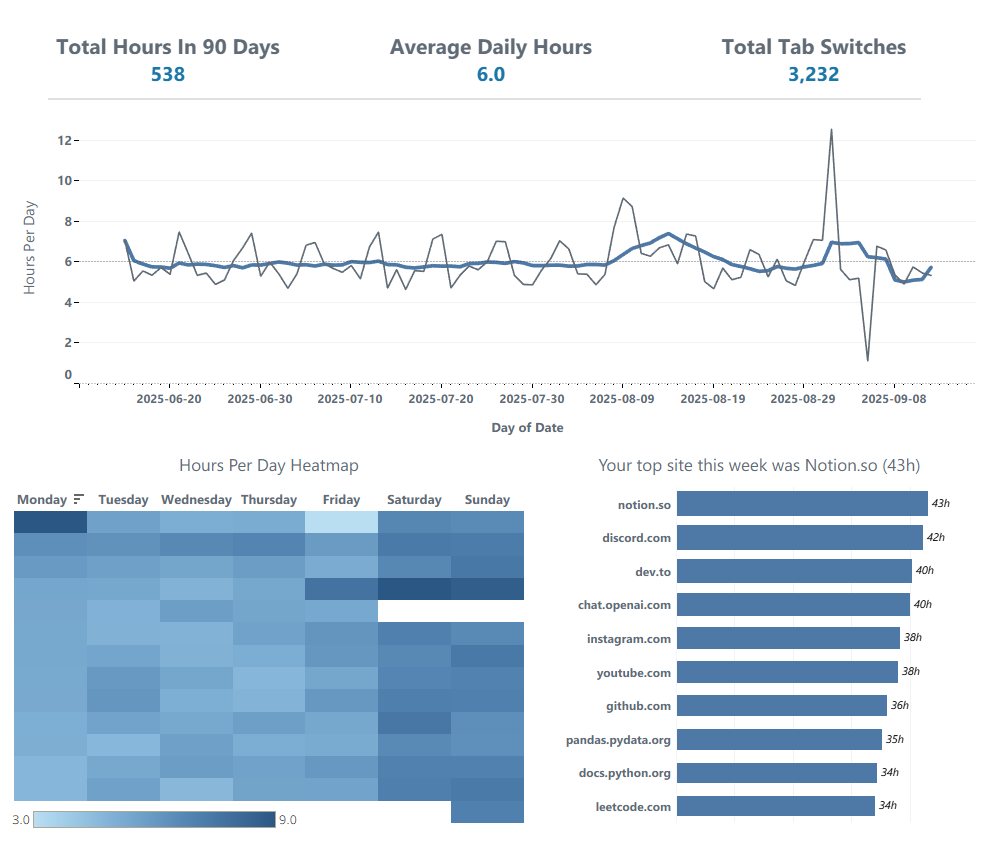
A lightweight, product style dashboard that reads like a weekly briefing - hours over time, daily rhythm heatmap, and a clean ranking of top domains. Built on top of my TimeLense browser extension so data collection, privacy, and export are all handled locally. In short, my browsing habits became the test case, the results spoke for themselves… and let’s just say a few domains didn’t survive.

Product AnalyticsTableauBehavior Insights
What it shows
  • Stats over 90 days
  • Trend with moving baseline
  • Weekday rhythm heatmap
  • Top domains with time spent
Why it’s useful
  • Clear readout in one glance
  • Explains habits, not just totals
  • Designed for simple, private tracking
1 / 4

Experience

Intern, Data/Engineering at Draugiem.lv

Jan 2025 to Jul 2025
Rīga, LV
  • Explored how a large scale platform structures and manages its data
  • Cleaned and organized datasets for reporting; practiced SQL queries and Excel reporting.
  • Worked independently most of the time, while receiving guidance from my internship lead.
PythonSQLExcelData Cleaning

Worked with my internship lead to understand how a large web platform operates and handles data. Got some practice turning raw data into useful insights. Spent time digging into website structures and cleaning up datasets, got used to teamwork and sharpened my eye for detail, and asked a lot of questions. This Internship gave me valuable context on how everything is done at scale.
Leasing Consultant at SIA MAGNESS

Aug 2024 to Oct 2024
Tukums, LV
  • Handled sensitive client and bank data with accuracy and care
  • Helped deals move faster by keeping communication clear
  • Learned to balance independence with teamwork under deadlines
Client Data HandlingCommunicationProblem Solving

I worked directly with clients and banks, making sure information stayed accurate and structured so deals could move quickly. I also got to work with sensitive information, which taught me how important care, trust, and attention to detail are. The role sharpened my communication, organization, and problem solving skills.

Data Analyst / Builder at Personal Projects

Jan 2023 to Sep 2025
  • TimeLense: local activity insights
  • SS.lv auto listings: scrape, clean, price patterns
  • Crypto event study: short window reactions around news
  • And more simple, easy projects to get a feel of things
PythonPandasMatplotlibScrapingTableauExperimentation

Outside of work, I’ve consistently built personal projects to learn and practice, from a Chrome extension that logs local activity so I can see my productivity, to scraping Latvian car listings and figuring out trends. Along the way I’ve also built smaller things for fun, like a browser snake game and a mini jump king with a friend.

Certificates

Google Data Analytics Certificate
Coursera 2025
View Certificate